Activity: Graphing Your Oil Future
- Share
- Tweet
- Pin
- Share
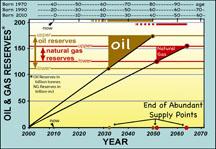
All petroleum data collected by Roger Kuhns, including sources from the USGS (2005, 2006), Department of Energy (2006, 2007), and European Union (2006-2008)
Make a graph that plots the ages of you and your family. Follow the birth date and age lines at the top of the oil and natural gas reserve graph. Note how old you and your family will be when the pessimistic (near) and optimistic (far) end of abundant oil and natural gas resources is reached. How will the scarcity of oil and natural gas affect your life and the lives of your extended family? How will this affect business and community? The graph shows that the period between 2032 and 2050 will present a profound global energy challenge.