State Economic Growth
- Share
- Tweet
- Pin
- Share
Jobs are a focus of the 2014 campaign, but candidate rhetoric on the subject often warrants scrutiny. Voters might want to know that Wisconsin’s economic course generally follows the nation’s. During 1998 – 2013, state gross domestic product (GDP) per capita grew an average of 3.3 percent per year vs. 3.5 percent for the US. That placed Wisconsin in the middle 10 of the 50 states.
“Jobs, jobs!” has become a mantra of the 2014 campaign in Wisconsin. Never mind that candidates, regardless of party: ignore the importance of job quality and wage levels; cherry pick data and time periods to convey only what they want; and fail to offer any context about the peculiarities of individual states that may skew results cited.
State vs. nation
Voters and the media are left with little useful information with which to assess how the state economy is performing. The figures presented here help fill that void by examining various state economies over a longer period of time and using a broader statistic, state output or gross domestic product (GDP).
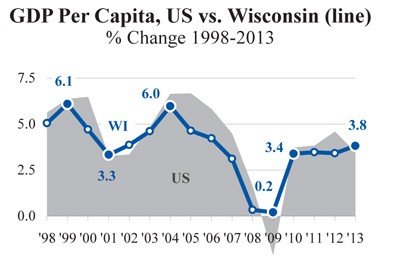
The graph to the right depicts changes in GDP per capita here and nationally over the most recent 15 years (1998 – 2013) and offers insights into the Wisconsin economy that differ from partisan rhetoric. First, the state and national economies largely move together. Thus, the impact that state politicians might have is limited.
Second, the state’s economy has neither grown nor contracted as much as the nation’s. And, finally, a close examination of the past two recessions (2002 and 2008) shows that Wisconsin tends to contract earlier, recover earlier, and “plateau” earlier than the rest of the country.
In the region
Wisconsin’s economic performance might better be gauged when compared to other states, particularly those in the same region. The table above summarizes GDP per capita and its average annual growth for 1998 – 2013, leading to conclusions that, again, may differ from candidate rhetoric.
First, since 1998, annual growth in the Badger State economy averaged 3.3 percent –compared to 3.5 percent for the nation – which placed it in the middle 10 of the 50 states.
Relative to other states in the upper Midwest, Wisconsin grew slower than Iowa (4.4 percent) and Minnesota (3.6 percent) but faster than Indiana and Illinois (both 3.2 percent), Ohio (3.1 percent), and Michigan (2.2 percent). Iowa outpaced the others largely because of a strong agricultural sector driven by subsidized ethanol use and rising corn prices.
Michigan, a heavy manufacturing state like Wisconsin and others to the east, lagged because of the automotive focus of its producing sector.
Drivers in high-growth states
Can growth be similarly related to specific strengths or weaknesses in the economies of other states? This is a difficult question that researchers tackle over months, even years, with sophisticated economic models. One question that might be asked is: Does industry mix factor into relative performance?

During 1998 – 2013, national per capita GDP rose an average of 3.5 percent per year. However, output in several industries significantly performed better: e.g., agriculture, health care, and natural resources and mining. Lagging industries included manufacturing (particularly durable goods manufacturing), transportation and warehousing, and retail trade.
Median (half lower, half higher) growth in the 10 fastest-growing states, led by North Dakota, Wyoming, Alaska, and Louisiana, was 5.1 percent. In 1998, these states were poised to take advantage of the ensuing growth in natural resources, health care, and several other industries. Median shares of state GDP in these industries were high – 3.1 percent in agriculture, 8.6 percent in natural resources and mining, and 6.5 percent health care/social services. Those shares were much smaller in slower-growing states.
Likewise, fast-growing states relied less on manufacturing (13 percent). That percentage rose as growth declined. In the 10 slowest-growing states, the median manufacturing share was 16.7 percent.
Much of Wisconsin’s middling growth over the past 15 years can be explained by its 1998 industry mix. Manufacturing was 25 percent of output, fourth highest nationally. Meanwhile, natural resources and mining were relatively minor here (1.9 percent and 28th). Health (6.7 percent, 12th) and agriculture (1.8 percent, 16th) were slight positives for the state.
The unanswered question is: Can Wisconsin position itself to take advantage of growing industries in the coming years?